1. JMeter is a framework for Java.
2. Download JMeter (Set JDK environment variable path)


2. Download JMeter (Set JDK environment variable path)
What is a Test Plan?
A Test Plan can be viewed as a container for running tests. It defines what to test and how to go about it. A complete test plan consists of one or more elements such as thread groups, logic controllers, sample-generating controllers, listeners, timers, assertions, and configuration elements. A test plan must have at least one thread group.
To run JMeter , go to the bin directory and click on "JMeter.bat" file.
1. Open the jMeter .
2. Rename the Test plan name.
3. Create ThreadGroup under test plan.Rename the Thread group as users.
4. choosing Add > Sampler > HTTP request option.
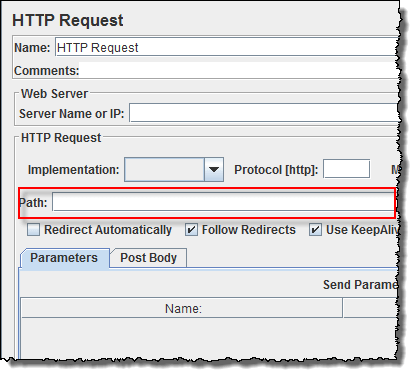
- Name − We will change the name to reflect the action what we want to achieve. We will name it as Visit Gmail.com Home Page
- Server Name or IP − Here, we have to type the web server name. In our case it is www.gmail.com. (http:// part is not written this is only the name of the server or its IP)
- Protocol − We will keep this blank, which means we want HTTP as the protocol.
- Path − We will type path as / (slash). It means we want the root page of the server.
5. To add a listener −
- Open the context menu
- Right-click the Thread Group (Users)
- Choose Add > Listener > View Results Tree option
6. Run The Test Plan.
7. To View the result:click on View Result Tree Listener.
We can also create test plan for database , WebService ,FTP, JMS ....


We can also create test plan for database , WebService ,FTP, JMS ....
Create a Performance Test Plan in Jmeter
In this tutorial, we are doing a performance analysis of Google.com for 1000 users
Before testing the performance of target web application, we should determine-
- Normal Load: Average number of users visit your website
- Heavy Load: The maximum number of users visit your website
- What is your target in this test?
Here is the roadmap of this practical example
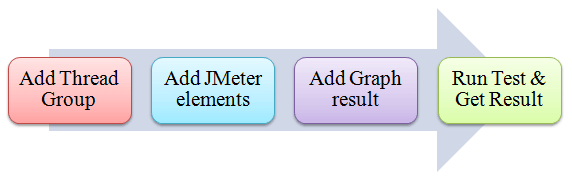
Step 1) Add Thread Group
- Start JMeter
- Select Test Plan on the tree
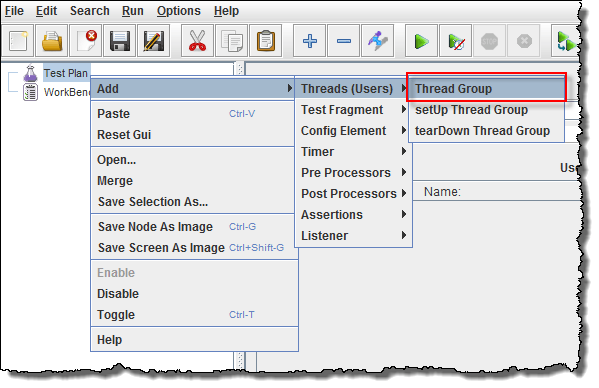
- Add Thread Group
Right click on the Test Plan and add a new thread group: Add -> Threads (Users) -> Thread Group
In Thread Group control panel, enter Thread Properties as following:
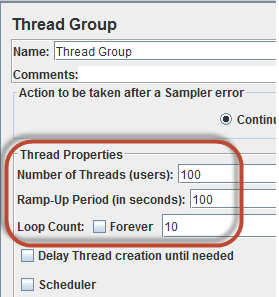
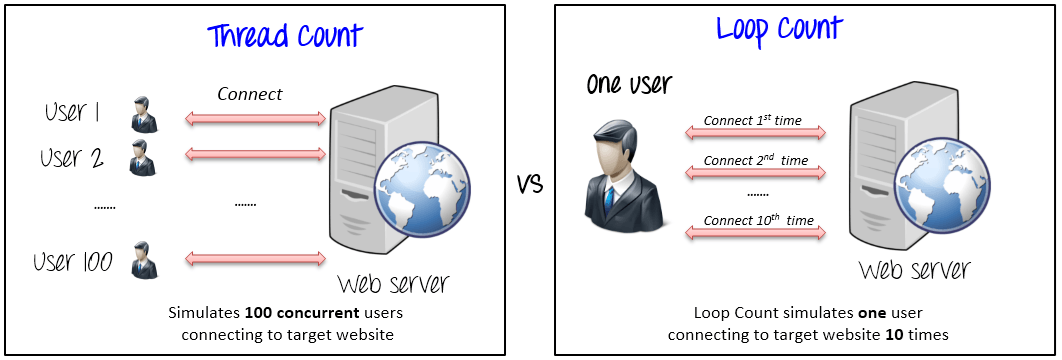
- Number of Threads: 100 (Number of users connects to target website: 100)
- Loop Count: 10 (Number of time to execute testing)
- Ramp-Up Period: 100
The Thread Count and The Loop Counts are different.
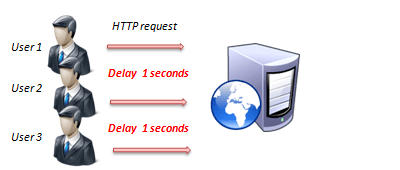
Ramp-Up Period tells JMeter how long to delay before starting next user. For example, if we have 100 users and a 100 second Ramp-Up period, then the delay between starting users would be 1 second (100 users /100 seconds)
Step 2) Adding JMeter elements
Now we determine what JMeter elements in this test. The elements are
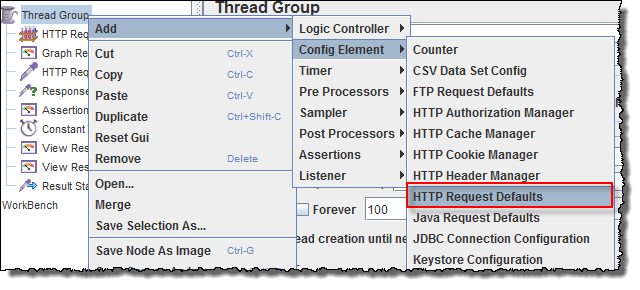
HTTP request Default
This element can be added by right-clicking on the Thread Group and selecting: Add -> Config Element -> HTTP Request Defaults.
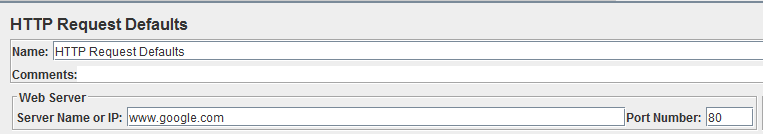
In the HTTP Request Defaults control panel, enter the Website name under test (http://www.google.com)
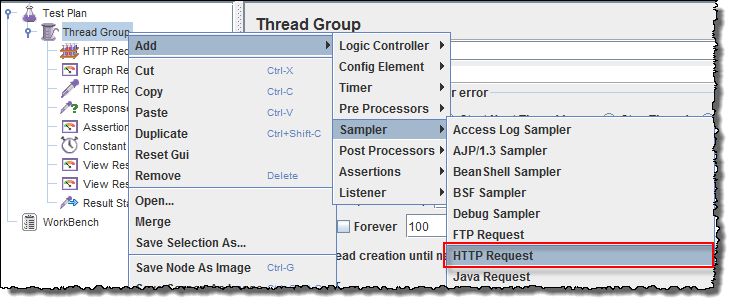
HTTP Request
Right-click on Thread Group and select: Add -> Sampler -> HTTP Request.
In HTTP Request Control Panel, the Path field indicates which URL request you want to send to Google server.
For example, if you enter "calendar" in Path field. JMeter will create the URL requesthttp://www.google.com/calendar to Google server
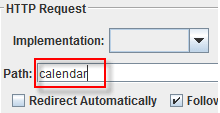
If you keep the Path field blank JMeter will create the URL request http://www.google.com to Google server.
In this test, you keep the Path field blank to make JMeter create the URL requesthttp://www.google.com to Google server.
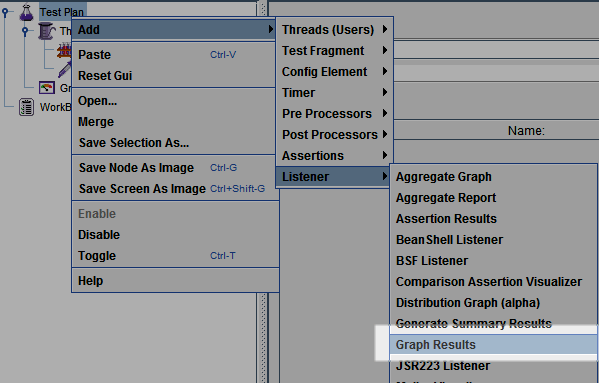
Step 3) Adding Graph result
JMeter can show the test result in Graph format.
Right click Test Plan, Add -> Listener -> Graph Results
Step 4) Run Test and get the test result
Press Run button (Ctrl + R) on Toolbar to start the testing process. You will see the test result display on Graph at the real time.
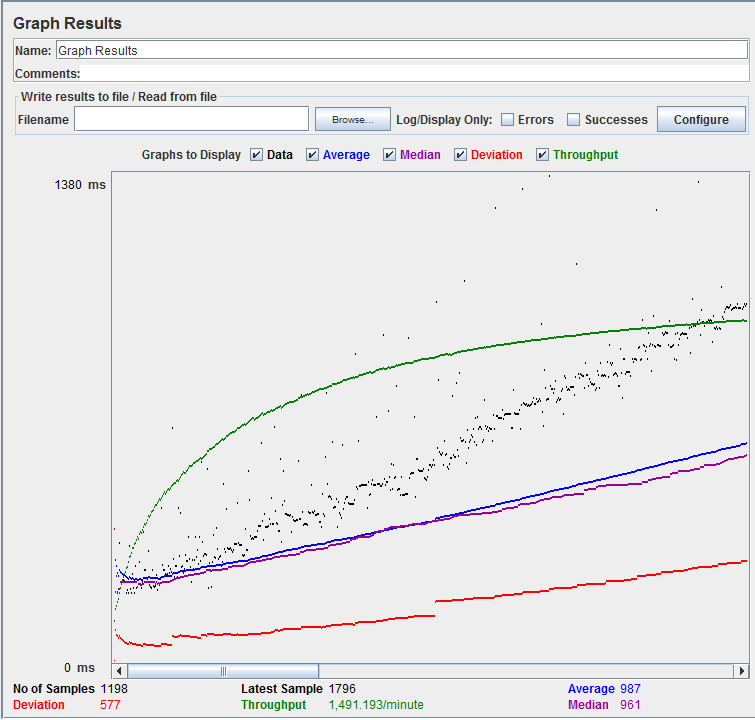
The picture below presents a graph of a test plan, where we simulated 100 users who accessed on websitewww.google.com.
At the bottom of the picture, there are the following statistics, represented in colors:
- Black: The total number of current samples sent.
- Blue: The current average of all samples sent.
- Red: The current standard deviation.
- Green: Throughput rate that represents the number of requests per minute the server handled
Let analyze the performance of Google server in below figure.
To analyze the performance of the web server under test, you should focus on 2 parameters
- Throughput
- Deviation
The Throughput is the most important parameter. It represents the ability of the server to handle heavy load. The higher the Throughput is, the better is the server performance.
In this test, the throughput of Google server is 1,491.193/minute. It means Google server can handle 1,491.193 requests per minute. This value is quiet high so we can conclude that Google server has good performance
The deviation is shown in red - it indicates the deviation from the average. The smaller the better.
Let compare the performance of Google server to other web server. This is the performance test result of website http://www.yahoo.com/ (You can choose other website)
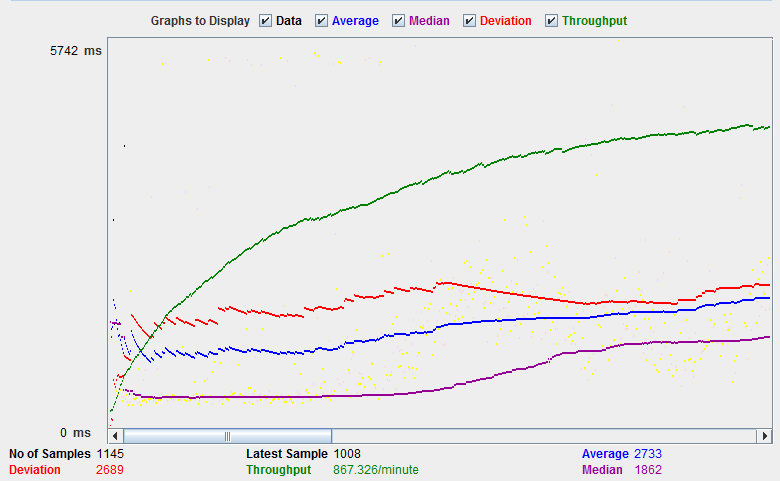
The throughput of website under test http://www.yahoo.com is 867.326/minutes. It means this server handle 867.326 requests per minute, lower than Google.
The deviation is 2689, much higher than Google (577). So we can determine the performance of this website is less than Google server.
NOTE: The above values depend on several factors like current server load at google , your internet speed, your CPU power etc. Hence, it's very unlikely that you will get the same results as above. So don't panic!
Troubleshooting:
If you face the issue while running the above scenario ... do the following
- Check whether you are connecting to internet via a proxy. If yes, remove the proxy.
- Open a new instance of Jmeter
- Open the PerformanceTestPlan.jmx in Jmeter
- Double Click on Thread Group -> Graph Result
- Run the Test
How to use Timers in Jmeter
Timers allow JMeter to delay between each request which a thread makes. Timer can solve the server overload problem.
Also, in real life visitors do not arrive at a website all at the same time, but at different time intervals. So Timer will help mimic the real time behavior.
Following are some common types of timer in JMeter
Constant Timer:
Constant timer delays each user request for the same amount of time.

Gaussian Random Timer:
Gaussian random timer delays each user request for a random amount of time.

Step 1) Add Thread Group
Right click on the Test Plan and add a new thread group: Add-> Threads (Users) ->Thread Group
In Thread Group control panel, enter Thread Properties as following

This setting lets JMeter create one user request to http://www.google.com in 100 times
Step 2) Add JMeter elements
- Add HTTP request default
- Add HTTP request
Step 3) Add Constant Timer
Right click Thread Group -> Timer -> Constant Timer

Configuring Thread Delay of 5000 milliseconds

Step 4) Add View Results in Table
View Results in Table displays the test result in table format.
Right click Add -> Listener -> View Result in Table

View Results in Table displays as below figure

Step 5) Run your test
When you ready to run test, click Run button on the menu bar, or short key Ctrl+R
This is the result of this test

You can analyze the result as following:
How to use Assertions in JMeter
Assertion help verify that your server under test returns theexpected results.
Following are some commonly used Assertion in JMeter:
Response Assertion

The response assertion lets you add pattern strings to be compared against various fields of the server response.
For example, you send a user request to the website http://www.google.com and get the server response. You can use Response Assertion to verify if the server response contains expected pattern string (e.g. "OK").
Duration Assertion
The Duration Assertion tests that each server response was received within a given amount of time. Any response that takes longer than the given number of milliseconds (specified by the user) is marked as a failed response.
For example, a user request is sent to www.google.com by JMeter and get a response within expected time 5 ms then test case pass, else, test case failed.

Size Assertion
The Size Assertion tests that each server response contains the expected number of byte in it. You can specify that the size be equal to, greater than, less than, or not equal to a given number of bytes.
JMeter sends a user request to www.google.com and gets response packet with size less than expected byte 5000 bytes àtest case pass. If else, test case failed.
XML Assertion
The XML Assertion tests that the response data consists of a formally correct XML document.

HTML Assertion
The HTML Assertion allows the user to check the HTML syntax of the response data. It means the response data must be met the HTML syntax.

Handson - Assertion
We will continue on the script we developed in the earlier tutorial.
In this test, we are using Response Assertion to compare the response packet from www.google.com matches your expected string.
Here is the roadmap of this test:

The response assertion control panel lets you add pattern strings to be compared against various fields of the response.
Step 1) Add Response Assertion
Right-Click Thread Group -> Add -> Assertions -> Response Assertion

Response Assertion Pane displays as below figure:

Step 2) Add Pattern to test
When you send a request to Google server, it may return some response code as below:
- 404: Server error
- 200: Server OK
- 302: Web server redirect to other page. This usually happens when you access google.com from outside USA. Google re-directs to country specific website. As shown below, google.com redirects to google.co.in for Indian Users.

Assume that you want to verify that the web server google.com responses code contains pattern 302,
On Response Field To Test, choose Response Code,
On Response Assertion Panel, click Add -> a new blank entry display -> enter 302 in Pattern to Test.

Step 3) Add Assertion Results
Right click Thread Group, Add -> Listener -> Assertion Results


Step 4) Run your test
Click on Thread Group -> Assertion Result
When you ready to run test, click Run button on the menu bar, or short key Ctrl+R.
The test result will display on Assertion Results pane. If Google server response code contains the pattern 302, the test case is passed. You will see the message displayed as follows:

Now back to Response Assertion Panel, you change the Pattern to test to from 302 to 500.

Because Google server response code doesn't contain this pattern, you will see the test case Failed as following:

How to use Controllers in JMeter
Logic Controllers
Logic Controllers let you define the order of processing request in a Thread. For example, you can use Random Controllers to send HTTP requests to the server randomly.
Logic Controllers determine the order in which user request are executed.
Some commonly used Logic controllers are below:

Recording Controller:
JMeter can record your testing steps; recording controller is a place holder to store these recording steps.

Simple Controller:
Simple Controller is just a container for user request.

Loop Controller:
Loop Controller makes the user request run specified number of times or run forever as shown in figure:

Random Controller:
Random Controller makes all the user requests run in random order in each loop period.
For example, you have 3 user requests to website http://www.google.com in following order:
- HTTP request
- FTP request
- JDBC request
These 3 requests should run 5 times; Total 15 (5*3) user requests will be sent to Google server by JMeter.
In sequential order, requests are sent sequentially in following order:
HTTP request ->FTP request->JDBC request
for each loop.

In random order, requests are sent as randomly,
FTP request ->HTTP request->JDBC request
Or
JDBC request ->FTP request->HTTP request
For each loop.
Module Controller:
The goal of Module Controller is to add modularity to JMeter.
The general idea is that web applications consist of small units of functionality (i.e. Logon, Create Account, Logoff...). This functionality can be stored in Simple Controller as "modules". Module Controller will choose which module needs to run.

Consider the following scenario -
- 50 users logging out,
- 100 users logging in
- 30 users search www.google.com
You can use JMeter to create 3 modules. Each module simulates each user activity: Login, Logout, and Search.

The Module controller chooses which module needs to run.

Other Important Controllers:
- Interleave Controller: picks up and makes one of user request run in each loop of the thread.
- Runtime Controller: controls how long its children are allowed to run.
For example, if you specified Runtime Controller 10 seconds, JMeter will run your test for 10 seconds.

- Transaction Controller: measures the overall time taken to finish a test execution
- Include Controller: is designed to use an external test plan. This controller allows you to use multiple test plans in JMeter. See detail in JMeter Performance Testing.
Handons with Loop Controller
This section shows you step-by-steps instruction to add Loop Controller setting to your current performance test plan.
The Loop Controller makes the samplers run as a certain number of times, in addition to the loop value you specified for the Thread Group. For example, if you
- Add one HTTP Request to a Loop Controller with a loop count 50
- Configure the Thread Group loop count to 2
- Then, JMeter will send a total of 50 * 2 = 100 HTTP Requests.
This is the roadmap of this example:
.png)
Step 1) Configuring Thread Group
We re-use the Step 1, 2 in tutorial JMeter Performance Testing.
Add Thread Group
Right click on the Test Plan and add a new thread group: Add-> Threads (Users) ->Thread Group
But in Thread Group control panel, enter Thread Properties as following:

It will make one user request to the web server google.com and run it 2 times.
Add JMeter elements
Add HTTP request default to www.google.com.
Adding Loop Controller
Right Click Thread Group -> Logic Controller -> Loop Controller

Step 2) Configuring Loop Controller
Add value 50 to Loop Count field as below figure. It will make one user request to the web server google.comrun it 50 times, in addition to the loop value =2 , you specified for the Thread Group above.So JMeter will send a total of 2 * 50 = 100 HTTP Requests.
.png)
Right click Loop Controller, Add -> Sampler -> HTTP request

Step 3) Add View Results in Table
We re-use Step 2 in Timer to add View Results in Table
So the test plan is shown in below figure

Step 4) Run your test
Now return View Results in Table, click Start button on Menu bar (Ctrl+R) to run test
As shown in the figure below, JMeter simulates one user request, which is sent 100 times, to the web serverhttp://www.google.com/. The Test is stopped after user request was sent in 100 times.

No comments:
Post a Comment